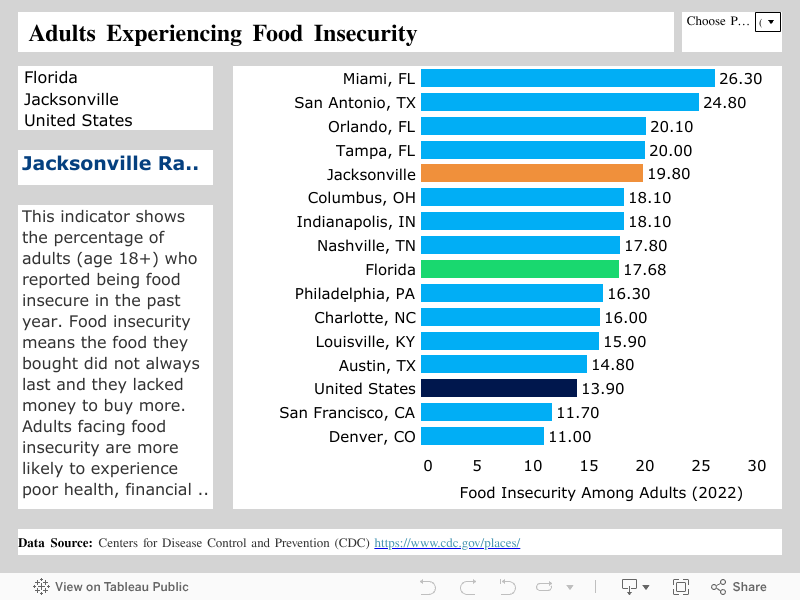
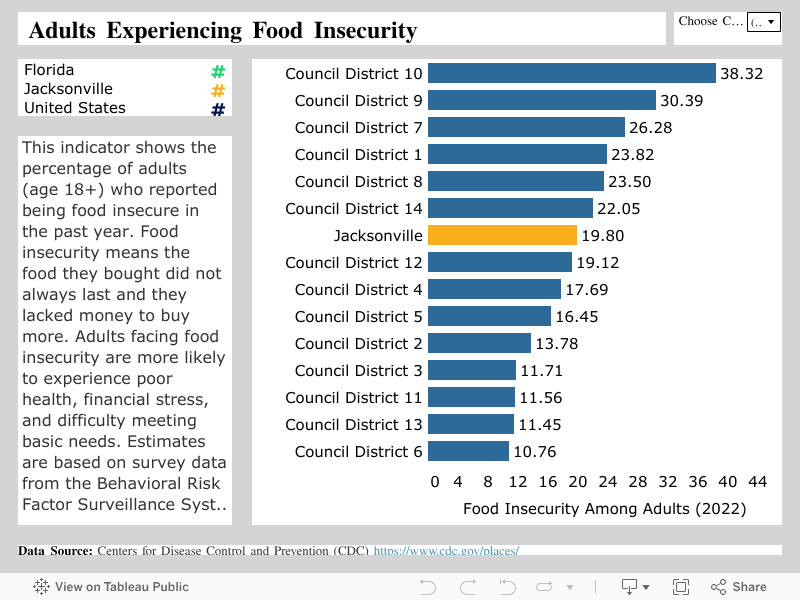

The percentage of adults (18 and older) who were food-secure in the past 12 months. Food security is calculated as 100 minus the percentage of adults reporting food insecurity (i.e., saying the food they bought did not last and they did not have money to buy more). Data is sourced from the Centers for Disease Control and Prevention (CDC), PLACES: Local Data for Better Health, which produces small-area estimates using the Behavioral Risk Factor Surveillance System (BRFSS) and U.S. Census ACS data.
Why does this Matter?
- Supports better health outcomes
- Food insecurity is associated with chronic and acute health problems and health care needs in children, and food-insecure adults are at a higher risk of developing several chronic conditions, including coronary heart disease, diabetes, obesity, and cancer. 1
- Improves workforce productivity
- A study from the National Institutes of Health found that food insecurity is strongly linked to fatigue, depression, and impaired cognitive function—all of which reduce workplace productivity. When employees are hungry, they’re not just less engaged—they’re more likely to be absent, make errors, and struggle with basic job tasks. 2
- Strengthens community well-being
- Consistent access to nutritious food reduces stress, fosters family and social stability, and helps children perform better academically—building more resilient and thriving communities. 3
- Thomas MMC, Miller DP, Morrissey TW. Food insecurity and child health. Pediatrics. 2019;144(4):e20190397. doi: https://doi.org/10.1542/peds.2019-0397
- Weinstein JM, Kahkoska AR, Berkowitz SA. Food Insecurity, Missed Workdays, And Hospitalizations Among Working-Age US Adults With Diabetes. Health Aff (Millwood). 2022 Jul;41(7):1045-1052. doi: 10.1377/hlthaff.2021.01744. PMID: 35787082; PMCID: PMC9840294.
- Zhang X, Bruening M, Ojinnaka CO. Food insecurity is inversely associated with positive childhood experiences among a nationally representative sample of children aged 0–17 years in the USA. Public Health Nutrition. 2023;26(11):2355-2365. doi:10.1017/S136898002300143X