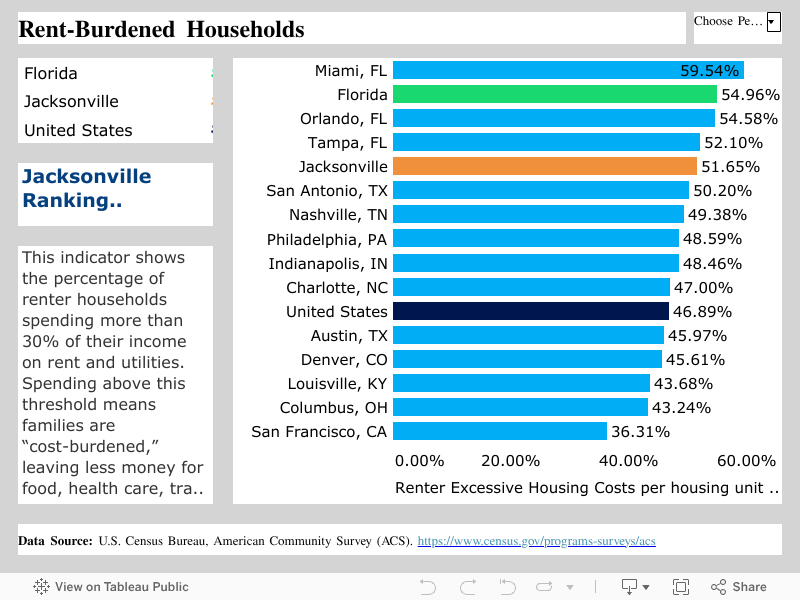
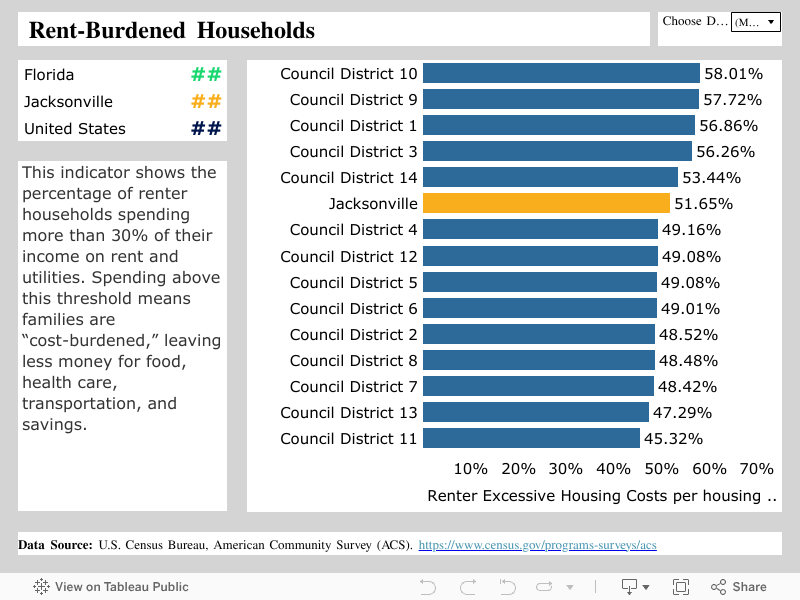

The percentage of renter-occupied housing units where monthly gross rent (including rent plus utilities and fuel costs) equals 30 percent or more of household income. The 30% threshold is widely used by the U.S. Department of Housing and Urban Development (HUD) to classify households as “cost-burdened.” The data is sourced from the U.S. Census Bureau, American Community Survey (ACS) 5-Year Estimates, Table B25070 (“Gross Rent as a Percentage of Household Income in the Past 12 Months”).
Why does this Matter?
- Health & increased mortality risk:
- Renters facing high housing cost burdens—spending ≥ 30% of income—experience higher risks of premature death, especially when coupled with eviction. This underscores how rent burden transcends financial stress and directly impacts life expectancy. 1
- Chronic, recurring cost burden and limited recovery:
- Housing cost burden among renters isn’t just a one-time issue—it tends to be persistent, deep, and long-lasting. This chronic burden hinders financial resilience, making it harder for households to bounce back from hardship. 2
- Strains family resources and child development:
- Low-income households burdened by rent allocate less toward children’s enrichment and education, which may lead to poorer cognitive outcomes and reduced opportunities for growth, impacting long-term community health and equity. 3
- Graetz, Nick & Gershenson, Carl & Porter, Sonya & Sandler, Danielle & Lemmerman, Emily & Desmond, Matthew. (2023). The impacts of rent burden and eviction on mortality in the United States, 2000–2019. Social Science & Medicine. 340. 116398. 10.1016/j.socscimed.2023.116398.
- Colburn G, Hess C, Allen R, Crowder K. The dynamics of housing cost burden among renters in the United States. J Urban Aff. 2025;47(7):2403-2422. doi: 10.1080/07352166.2023.2288587. Epub 2024 Jan 9. PMID: 40786934; PMCID: PMC12333583.
- Divringi, E. (Spring 2017). Rental Housing Affordability Impacts Educational and Employment Opportunities (Cascade No. 95). Economic Growth & Mobility Project, Federal Reserve Bank of Philadelphia.