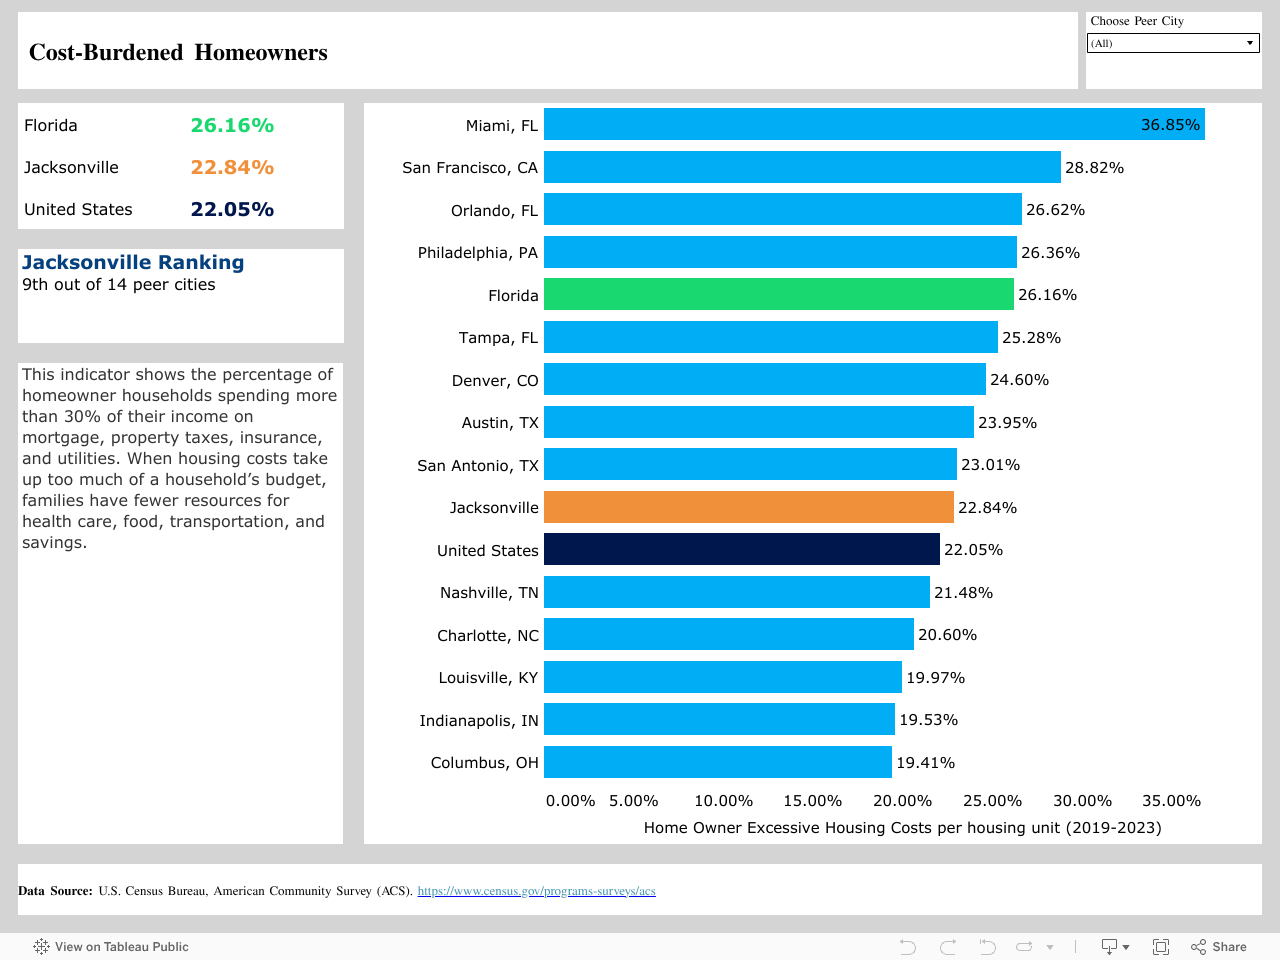
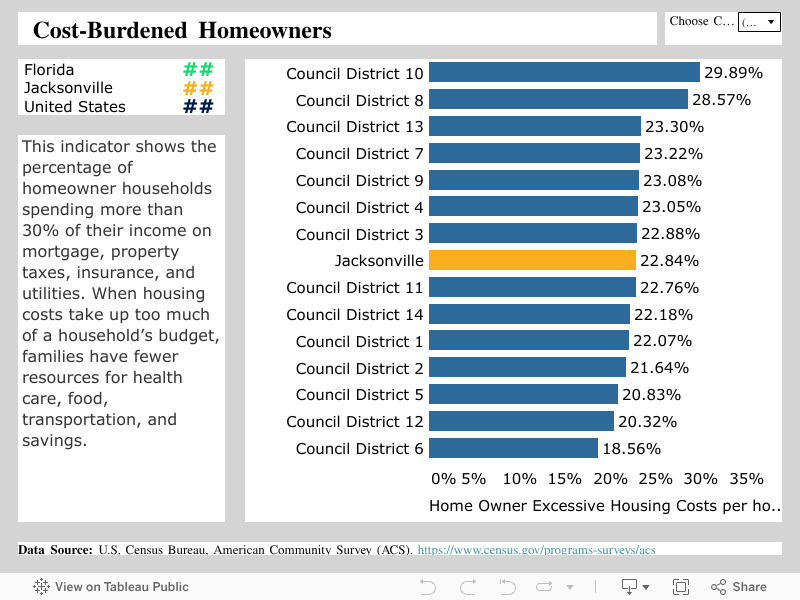

The percentage of owner-occupied housing units where monthly housing costs (including mortgage, property taxes, insurance, utilities, and condo fees if applicable) equal 30 percent or more of household income. This is considered a “cost-burdened” threshold by the U.S. Department of Housing and Urban Development (HUD). Data is sourced from the U.S. Census Bureau, American Community Survey (ACS) 5-Year Estimates, Table B25091 (“Mortgage Status by Selected Monthly Owner Costs as a Percentage of Household Income in the Past 12 Months”).
Why does this Matter?
- Increases financial and mental stress:
- Rising housing-related expenses, including insurance, property taxes, utilities, and maintenance, create cost burdens that significantly strain lower-income and older homeowners on fixed incomes. This contributes to financial stress and poses a threat to long-term stability. 1
- Undermines children’s educational and developmental outcomes:
- Excessive housing cost burdens leave families with fewer resources for enrichment, inadvertently harming children’s cognitive development and school performance. 2
- Damages overall health and well-being:
- When homeowners spend too much on housing, they must often cut back on healthcare, nutritious food, or other essentials—leading to poorer health outcomes and reduced quality of life. 3
- McCue, D., Airgood-Obrycki, W., & Whitney, P. (2025, February 24). Rising Costs of Homeownership Are a Growing Burden. Joint Center for Housing Studies of Harvard University.
- Divringi, E. (Spring 2017). Rental Housing Affordability Impacts Educational and Employment Opportunities (Cascade No. 95). Economic Growth & Mobility Project, Federal Reserve Bank of Philadelphia.
- Pollack, Craig Evan et al., “Housing Affordability and Health Among Homeowners and Renters,” American Journal of Preventive Medicine, Volume 39, Issue 6, 515 – 521